Libraries, Data, and DJs: Catching up on 10 years of work
To kick off this tiny newsletter, and for those unfamiliar with my work, I will, as briefly as I can, catch you up on the last ~10 years of my work, from about 2015 to 2024.
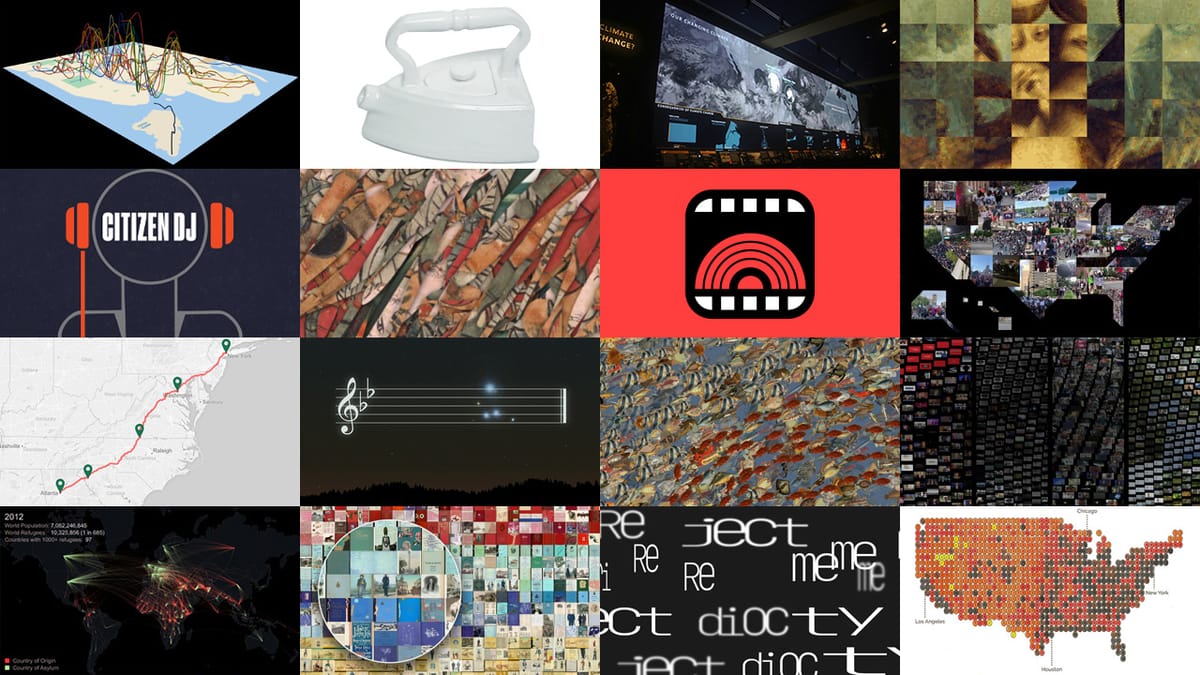
In 2015, I am working in the group formerly known as New York Public Library (NYPL) Labs (I started in 2012) where I am co-designing and developing the Library's Digital Collections website. In my spare time, I am continuing my Data-Driven DJ series, where I turn data into music, including songs about income inequality, refugee movement, and brain wave data.
In 2016, my work on NYPL's Digital Collections website culminates in a Public Domain Release of over 180K digital items into the public domain. For this release, I visualize these 180K items and create an interactive map and trip visualizer using NYPL's Green Book collection, a travel guide published between 1936 and 1966 that listed businesses where black travelers would be welcome. In my spare time, I continue to experiment with data visualization and sonification. I make the lights in my home shine based on how often I see my friends. I turn stellar data into an interactive music-making experience. And I convert spoken word into sheet music.
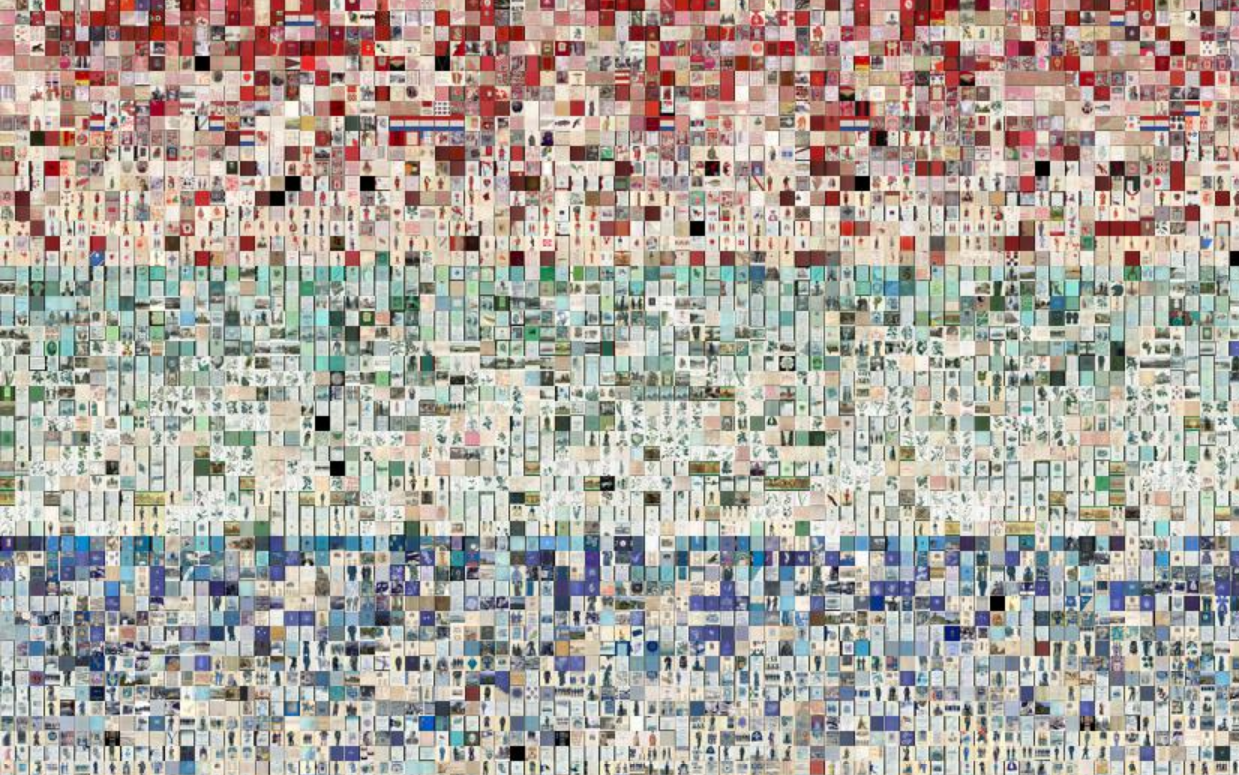
In 2017 and 2018, I start working at the American Museum of Natural History (AMNH) where I co-design and develop the Museum's first permanent and interactive exhibit on climate and climate change. This follows a personal project where I create a climate change coloring book. I continue to experiment with data visualization and sonification: I 3D-print a set of porcelain dinnerware inspired by people, objects, and events in Chinese American history. I turn global data into music. I create a virtual radio with the sounds of my friends' morning routines.
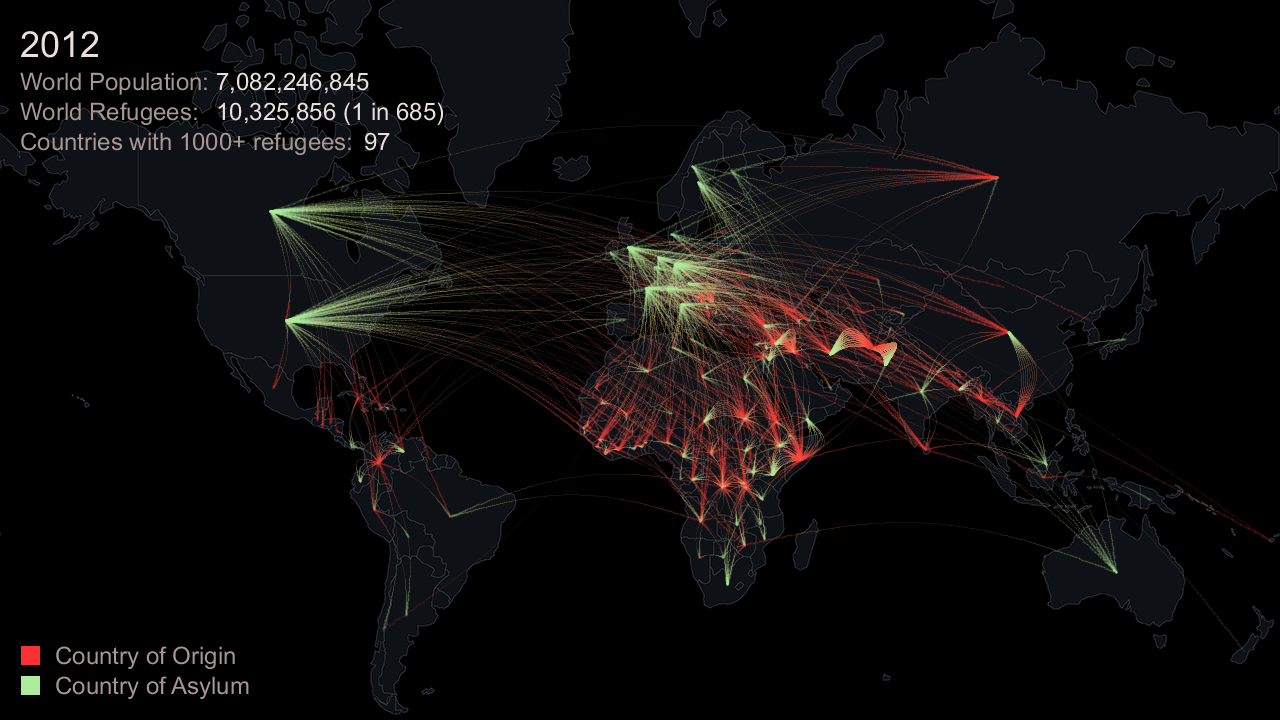
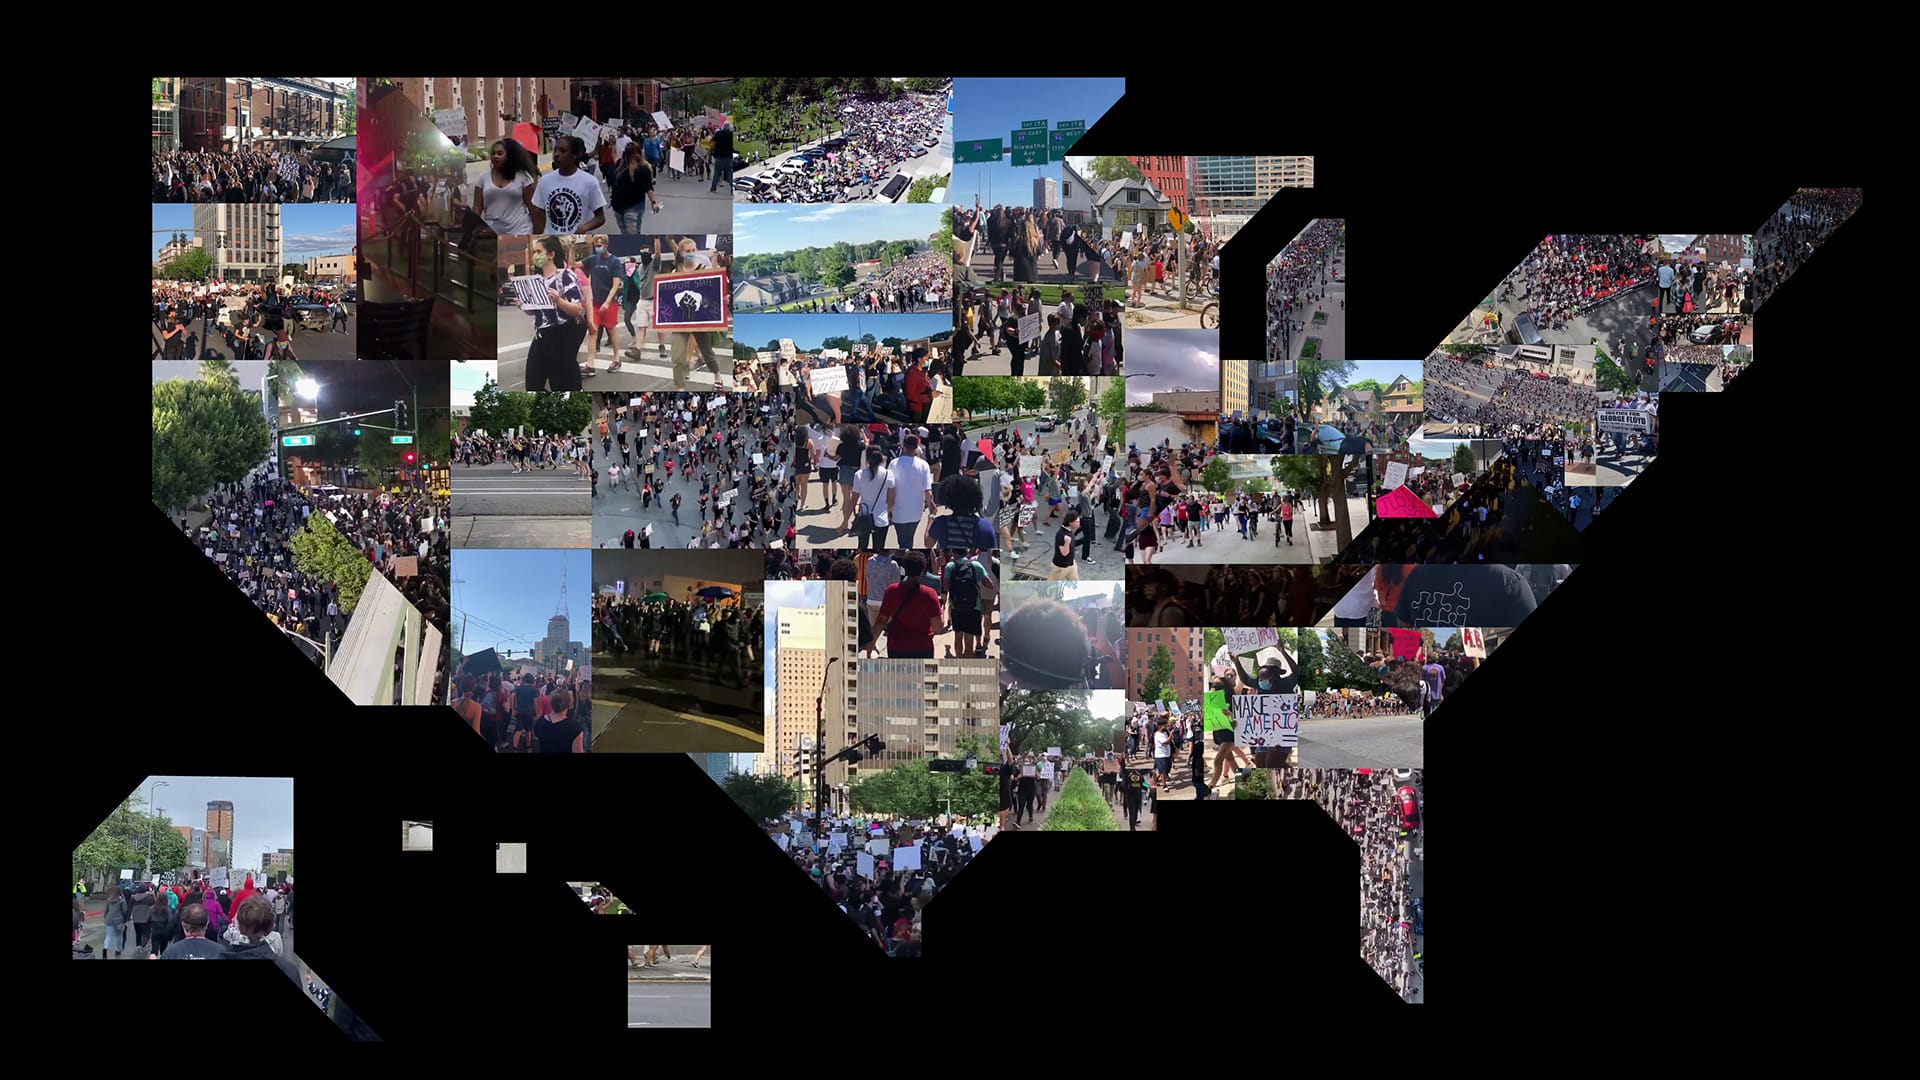
In 2019 and 2020, I focus on immersion and visualization large collections of images and video. I visualize AMNH’s Photographic Collection. I create a video series that visualizes and immerses you in thousands of hours of footage from public moving image archives. I produce an experimental film that immerses you in the lives of 12 people from 12 different countries over the course of 24 continuous hours. I also create an interactive sound map that immerses you in the sounds of 50 Black Lives Matter protests in the 50 states of the U.S. During this time, I am also the Innovator In Residence at the Library of Congress, where I am creating tools to create new hip hop music using the Library's free audio and video materials.
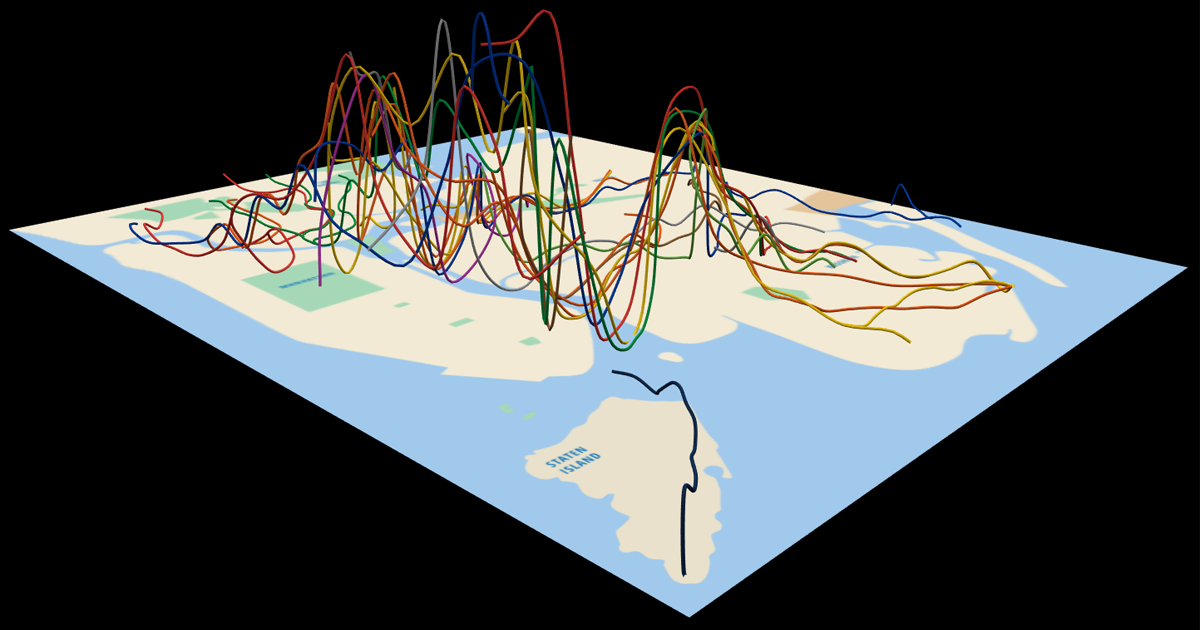
In 2021, I continue to create interfaces for interacting with data and large collections of material. I produce custom digital brushes for creating large scale collages using public domain scientific illustrations of plants and animals from the Biodiversity Heritage Library. I create an interactive 3D map that makes income inequality visible along the NYC Subway. I develop an interface for exploring the monument landscape across the country. I also co-design and develop a 3D software engine for visualizing museum collections across time and space.
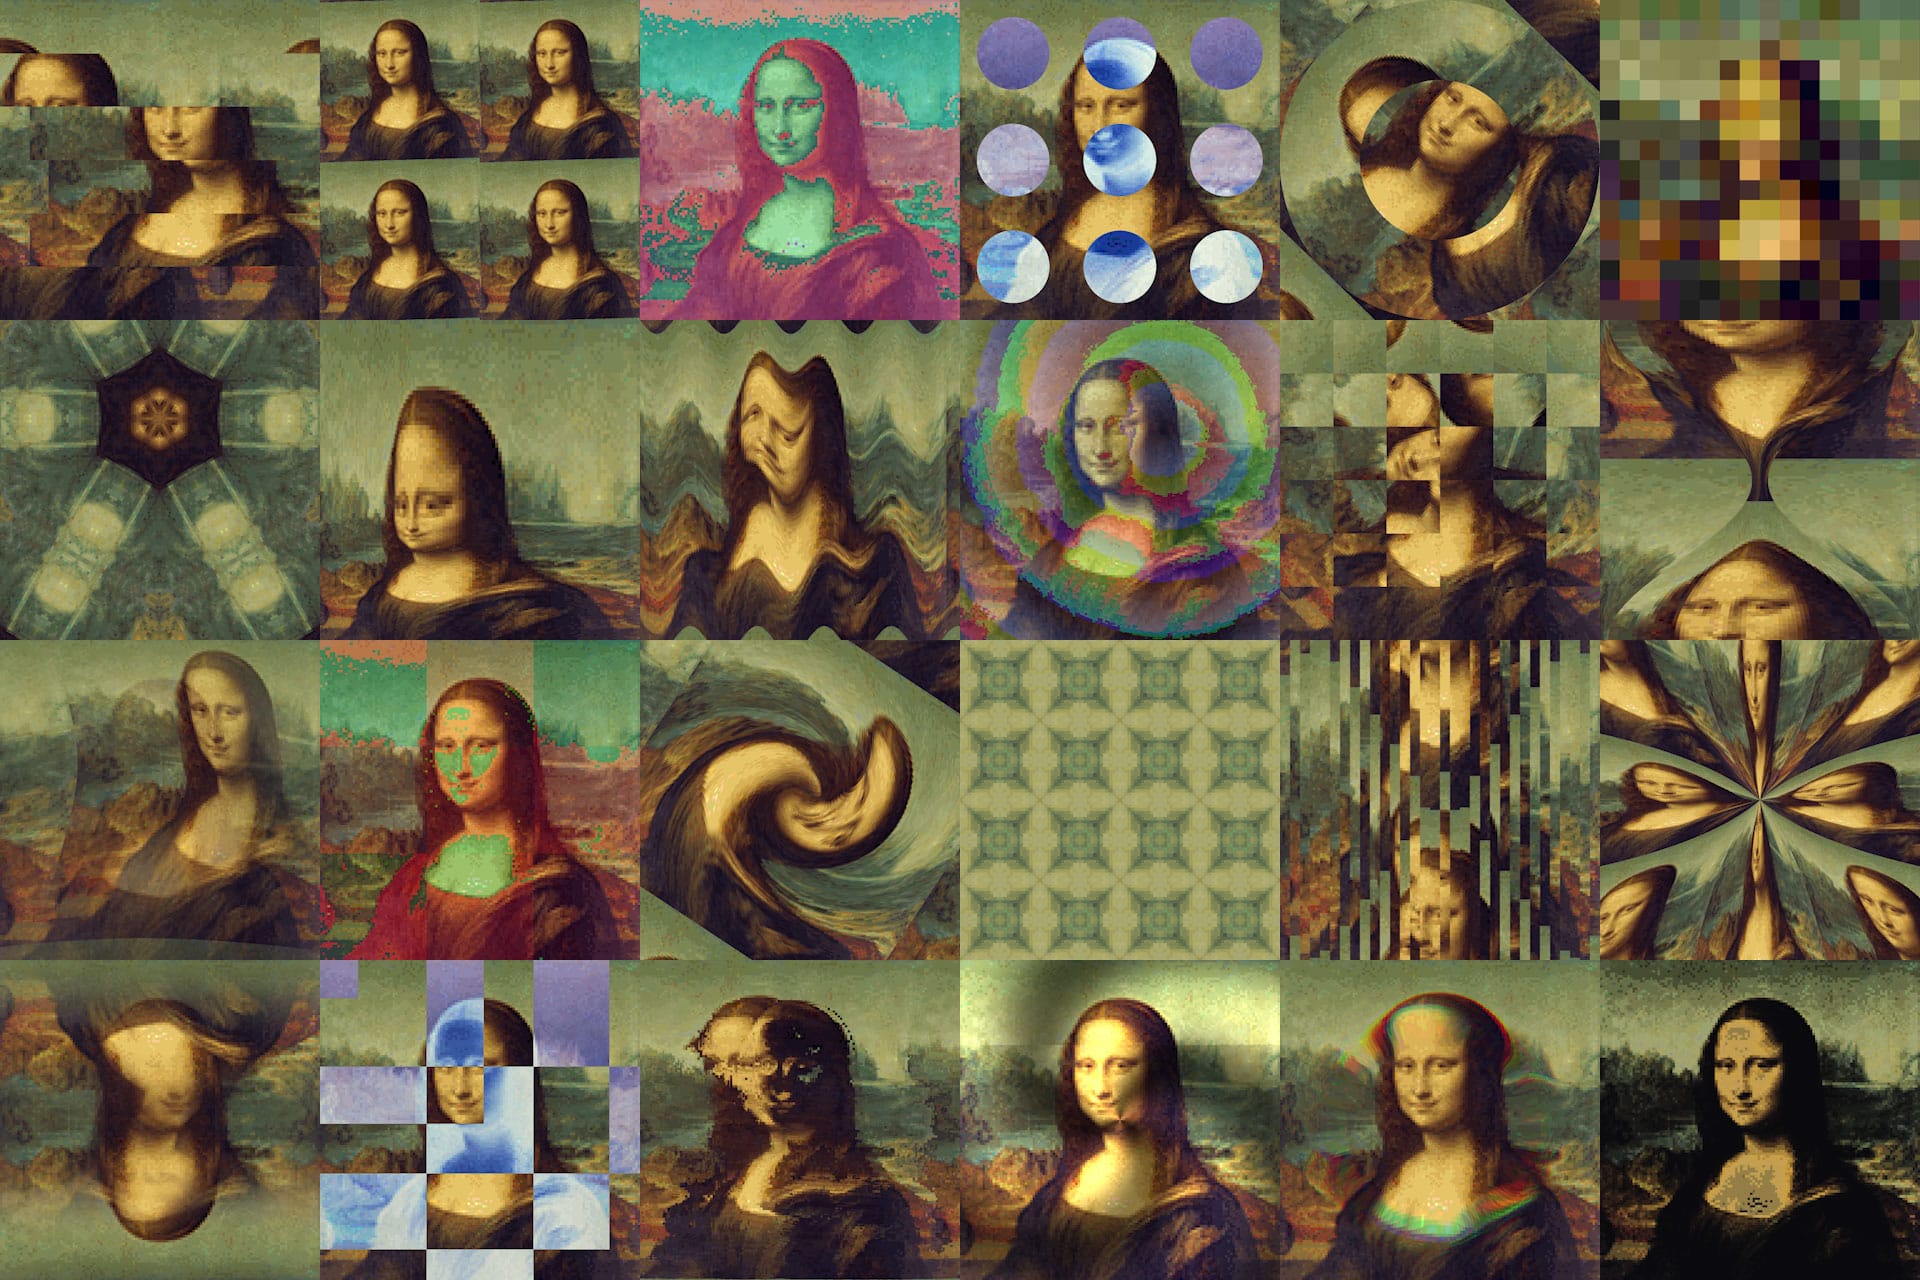
From 2022 to 2024, my work tends toward fun and playful interfaces for remixing sound and art, inspired by the births of my two daughters. I create a collage tool using fragments of visual culture from renowned museums and libraries, an online tool for making beats with the kicks, snares, and hi-hats that are hidden within historical speech, an app for demolishing and recycling famous artworks efficiently and beautifully, and an online tool for playing with people’s words. During this time, I also join the Digital Innovation Division (LC Labs) at the Library of Congress where I support innovative and imaginative uses of the Library’s content and services.
Now that we're all caught up, this newsletter will focus on new and current projects. Thank you for reading!